

Greeks as exposures, not formulas
Overview
Many traders first meet the Greeks as formulas. That can make them feel more complicated than they need to be. In practice, they are often more useful when understood as exposures: measurable sensitivities that tell you how an option price or an options position may respond to small changes in the main drivers of value.
Those drivers are straightforward. Price moves in the underlying affect delta and gamma. Time passing affects theta. Changes in implied volatility affect vega. Read this way, the Greeks are less about memorising symbols and more about seeing what kind of risk you hold right now.
This framing also helps with practical trading decisions. If your position is too directional, delta shows it. If a small move could quickly change that directional exposure, gamma matters. If time is helping or hurting you each day, theta matters. If implied volatility can move the mark even without a price change, vega matters.
The useful habit is not to ask, "What is the formula?" but "What am I exposed to, in what units, and at what scale?" That means checking whether a platform shows Greeks per share or per contract, confirming the contract multiplier, and making sure you are looking at instrument Greeks or full position Greeks before you act.
Definitions
Delta measures the change in an option price for a $1 change in the underlying price, with other inputs held constant. It is usually shown in dollars per share per $1 move. On many platforms that is a per share figure, so you need to multiply by the contract multiplier, commonly 100 for U.S. equity options, to convert it to a per contract exposure.
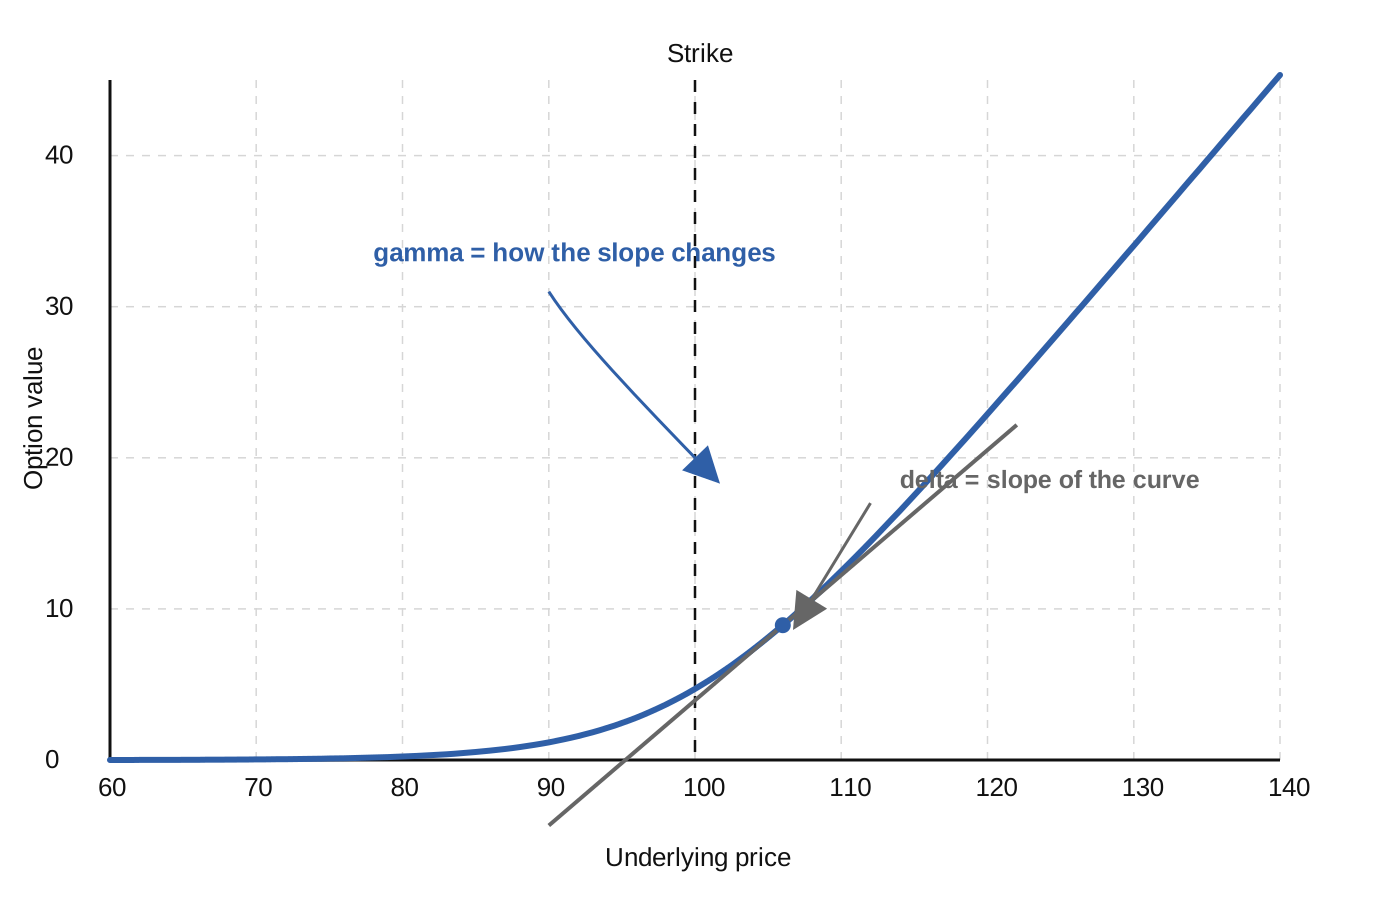
The sign convention is simple. Calls have positive delta. Puts have negative delta. Call delta usually ranges from about 0 to +1, while put delta usually ranges from 0 to -1.
Used practically, delta is the small move directional exposure and the hedge ratio for small moves. It is often used as a rough, model dependent probability proxy, but it is not literally the risk neutral probability of finishing in the money.
Theta measures the change in option price as one day passes, with other inputs held constant. It is usually shown in dollars per share per day.
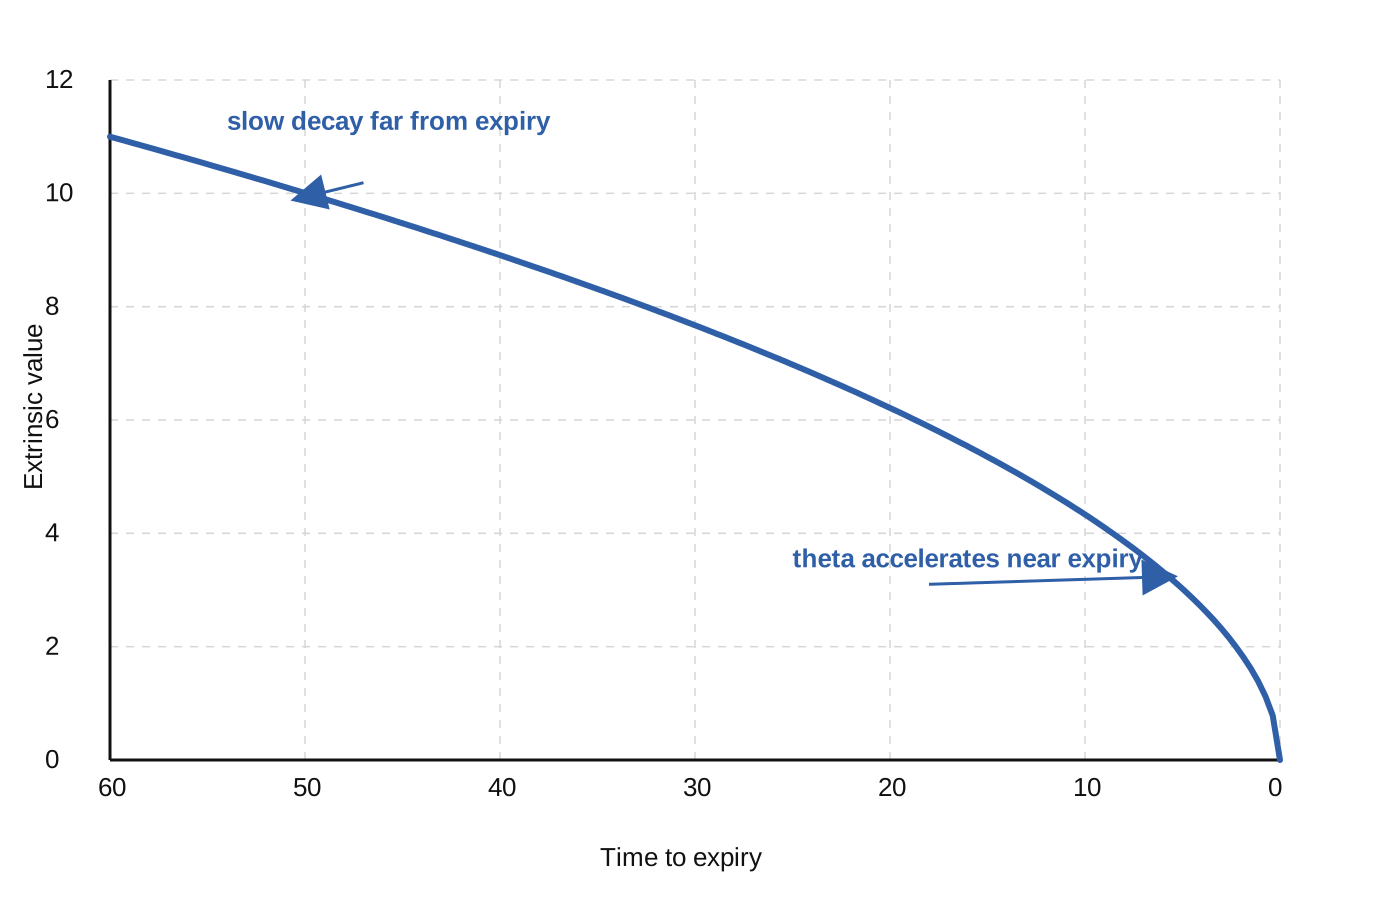
For long options, theta is typically shown as a negative number because time value decays as time passes. Time decay tends to accelerate as expiration nears and is small for options that are far in the money or far out of the money.
Theta is best understood as the daily carry of the position. It tells you whether the clock is generally working for you or against you, while recognising that the effect is not linear as expiry approaches.
Step by step walkthrough
The exposure loop
A practical way to use the Greeks is to follow the same loop each time: identify the exposures on the chain, scale them correctly, aggregate them to the position, run simple price, time and volatility scenarios, then decide whether an adjustment is needed.
This loop works because the Greeks are not static labels. Delta changes with price. Gamma tends to rise near the money and near expiry. Theta typically accelerates as expiration approaches. Vega is usually strongest near the money and with longer expirations. The point is not to find one permanent reading, but to keep updating the exposure picture as the trade evolves.
Worked examples
The examples below use rounded numbers to show how exposures behave. The assumptions are a contract multiplier of 100, ignored interest and dividends, and simple Greeks at the starting point. The key idea is not precision to the last cent but reading how the exposure picture changes as price, time and implied volatility change.
Start with an underlying at $100 and buy 1 at the money call with strike 100 and 14 days to expiry at a mid market price of $3.00. The chain shows per share Greeks of delta +0.50, gamma 0.06, theta -0.08 and vega 0.10.
Scaled to one standard contract, that becomes about +50 delta, +6 gamma, -$8 per day theta and +$10 per volatility point. That translation from per share to per contract is essential because it turns a display figure into an actual position exposure.
If the underlying rises by $1 to $101 on the same day and implied volatility is unchanged, delta rises by roughly gamma times the move, so the new delta is about 0.56 per share. The option gains roughly $0.50 to $0.60 from the delta effect, and the position becomes longer stock equivalent after the move because positive gamma increased delta.
Now suppose three trading days pass, the price returns to $100 and implied volatility is unchanged. Using the starting theta as a simple guide, the contract loses about 3 × $8 = $24 from time decay, while recognising that theta typically accelerates as expiry approaches. Delta drifts back towards about 0.50, while gamma and theta are both higher than they were at 14 days to expiry.
Finally, suppose the price is $101 and implied volatility rises by 2 points with 11 days to expiry. The price effect is about $0.56 per share and the volatility effect is about 0.10 × 2 = $0.20 per share, for a combined move of about +$0.76 per share before second order effects. The example shows why it helps to separate the move into price exposure and volatility exposure rather than treating the whole mark change as one thing.
| Measure | Basis | Value |
|---|---|---|
| Underlying price | At the money, strike 100, 14 days | $100.00 |
| Call premium | Mid market | $3.00 |
| Delta | Per share | 0.5 |
| Gamma | Per share | 0.06 |
| Theta | Per share, per day | -0.08 |
| Vega | Per share, per volatility point | 0.1 |
| Contract delta | 0.50 times 100 | 50 |
| Contract gamma | 0.06 times 100 | 6 |
| Contract theta | Minus $8 per day | $-8.00 |
| Contract vega | Plus $10 per volatility point | $10.00 |
| Delta after $1 rise | About gamma times the move | 0.56 |
| Time decay over 3 days | About 3 times $8 | $-24.00 |
| Combined move, $101 and IV +2 points | Price effect plus volatility effect | $0.76 |
| Contract delta | 50 | |
Now take an underlying at $100 and sell 1 95 put while buying 1 90 put, both with 21 days to expiry, for a net credit of $1.00. Suppose the net per share Greeks at inception are roughly delta -0.15, gamma -0.02, theta +0.03 and vega -0.05. Per contract, each is multiplied by 100.
First shock: five days later, the underlying is still $100 but implied volatility rises by 5 points. The spread value rises against you by about vega × 5, or -0.05 × 5 = -$0.25 per share, which is about -$25 per contract. The important point is that the position can lose even without a price move because it is short volatility.
Second shock: with 6 days to expiry, the underlying falls to $96 and implied volatility stays elevated. Delta becomes more negative and gamma becomes more negative near the short 95 strike. Mark to market swings become larger as expiry nears because short dated, near the money options have higher gamma and theta.
If the price later stabilises above 95 and implied volatility normalises, positive theta works in your favour each day and the spread tends towards zero value into expiration. This example shows the trade off clearly: time decay can help, but short volatility and negative gamma can hurt sharply when conditions move the wrong way.
| Measure | Basis | Value |
|---|---|---|
| Net credit | Short 95 put, long 90 put, 21 days | $1.00 |
| Delta | Net per share | -0.15 |
| Gamma | Net per share | -0.02 |
| Theta | Net per share | 0.03 |
| Vega | Net per share | -0.05 |
| Value change, IV +5 points | Minus 0.05 times 5 | $-0.25 |
| Value change per contract | Minus 0.25 times 100 | $-25.00 |
| Value change per contract | $-25.00 | |
Checklists
A checklist keeps the Greeks practical. It helps prevent the two common mistakes: reading a display value without scaling it properly, and reacting to a market print without checking whether the quote is actually reliable.
Pre trade exposure checklist
Monitoring and adjustment checklist
Glossary
- Contract multiplier
The number of underlying units per contract used to scale prices and Greeks. U.S. equity options commonly use 100, but exceptions exist.
- Delta
First order price sensitivity to the underlying. It measures the option price change for a $1 move in the underlying, usually on a per share basis unless stated otherwise.
- Gamma
The rate of change of delta for a $1 move in the underlying. It is a measure of convexity.
- Theta
Sensitivity to time. It describes the expected daily change in option value as one day passes, with other inputs held constant.
- Vega
Sensitivity to a 1 point change in implied volatility, usually shown on a per share basis.
- NBBO
National Best Bid and Offer, the consolidated best bid and ask prices across U.S. options exchanges.
- Implied volatility surface
The pattern of implied volatility across strikes and expirations, including skew or smile across strikes and term structure across maturities.
Verified callouts
Delta is an exposure to small price changes, not a probability
Delta is the small move sensitivity of an option to its underlying and functions as a hedge ratio for small moves. Traders often use it as a rough probability proxy, but it is not literally the risk neutral probability of finishing in the money.
Vega is per volatility point and is usually highest near the money
Vega measures the change in option price for a 1 percentage point change in implied volatility. For a given expiration, it is typically largest for at the money options, and longer expirations generally have larger vega.
Gamma drives how delta changes and tends to grow as expiry approaches
Gamma shows how quickly delta changes when price moves. It is typically largest for near the money options and increases as expiration approaches, which makes short dated at the money options especially sensitive to price changes.
Internal links
Definitions
- Contract Multiplier and Adjustments
- Moneyness (ITM/ATM/OTM) and its impact on Greeks
- NBBO vs Last Trade; Bid Ask Spread Mechanics
- Implied Volatility, Vega, and the Volatility Surface
- Local vs Large Move Risk: Limits of Greeks and Second Order Effects
- Instrument vs Position vs Portfolio Greeks
- Scenario Analysis Basics
High level comparison
Delta answers: if the underlying moves a little, how much should the option price move right now? Gamma answers: if the underlying moves, how much will delta itself change? Theta answers: if a day passes, what does the clock do to the option value? Vega answers: if implied volatility changes by 1 point, what happens to the option price?
Seen together, the Greeks are a compact risk map. Delta is current directional exposure. Gamma is how unstable that directional exposure may become after a move. Theta is the daily effect of time passing. Vega is the sensitivity to changing implied volatility. Treating them as exposures keeps the focus on what can change your position next, not on memorising notation.
Using Greeks as exposures in practice
In practice, the most important distinction is not mathematical but operational. A Greek on a screen is only useful if you know its unit, its sign, its multiplier and whether it refers to one instrument or the whole position. Most avoidable mistakes come from getting one of those four details wrong.
That is why an exposure first approach works so well. Read the chain from the NBBO, not from a stale last trade. Translate per share Greeks into per contract and then full position exposures. Check how those exposures change under small price, time and implied volatility moves. Then decide whether the resulting risk still fits the trade.
Used this way, the Greeks become a practical language for managing options. They do not remove uncertainty, and they are local rather than all purpose forecasts, but they do help you describe clearly what your position is exposed to now and what is most likely to move it next.
Sources
- Options Clearing Corporation: Characteristics and Risks of Standardized Options
- Cboe Options Institute glossary
- Equity Options Specifications
- Nanos multiplier overview
- Options Institute Options Calculator
- Cboe methodology for implied volatility calculations
- Delta overview
- Gamma overview
- Theta overview
- Volatility and the Greeks
- Understanding the Bid and Ask Prices for Options
- Volatility Skew and Options: An Overview
- Options Vega: The Greeks
- Interactive Brokers TWS notes on instrument versus position Greeks
- FINRA options basics