

Risk First, Profit Second
Overview
Risk in trading is the possibility that a trade, a group of trades, or the account as a whole suffers a loss large enough to matter. In plain English, risk is not just that price might move the wrong way. It is uncertainty plus consequences: how much could be lost, how fast it could happen, under what conditions it could happen, and whether the account can continue afterwards.
A risk first approach begins with a different question from the one many beginners ask. Instead of starting with how much a trade might make, it starts with what can go wrong, what that would cost, and whether the account can survive it. That shifts attention away from prediction and towards exposure, loss control, and survival across the full life of the trade.
This matters because leverage, concentration, volatility, and product structure can amplify losses. Some strategies and products can lose all capital or more than the initial outlay. A trade can look attractive on the upside and still be unacceptable once the downside is measured properly.
Operationally, the sequence matters. A sound trade plan defines maximum acceptable loss first, then position size, then account level impact, then event and correlation risks, then exit handling. Only after those steps does it make sense to discuss possible return.
Return still matters, but it comes after risk has been defined, sized, and tested. A trade is not good simply because the target looks large. If the account becomes fragile when the trade goes wrong, the profit idea comes second to the survival problem.
Key definitions
Step by step walkthrough
The risk first loop
Risk first is not a one-time calculation. It is a repeating loop that starts with the maximum acceptable loss and ends by checking whether the account remains in a condition to continue. The focus stays on survivability at trade level and account level.
Worked examples
The following examples show how a risk first process works in practice. The point is not to predict return. The point is to define loss, size the trade, and understand what happens to the account if conditions are worse than planned.
Assume account equity is £10,000 and maximum risk per trade is 1% of the account, which is £100. The instrument is shares, planned entry is £50, stop is £48, and estimated costs and slippage allowance are £10 total.
First calculate price risk per share: £50 minus £48 equals £2. Next reserve room for friction. Total allowed loss is £100, but £10 is set aside for costs and slippage, leaving £90 available for pure price movement risk.
Now calculate maximum position size: £90 divided by £2 equals 45 shares. The resulting position value is 45 multiplied by £50, which is £2,250.
If the market falls cleanly to the stop and execution is close to plan, the price move loss is 45 multiplied by £2, which is £90. Adding the £10 allowance gives a total planned loss of £100.
If the market gaps below the stop and execution occurs at £47.50 instead, actual price loss becomes 45 multiplied by £2.50, which is £112.50, plus costs. This shows why actual loss can exceed intended loss when stops do not fill at the selected level in fast conditions.
| Measure | Basis | Value |
|---|---|---|
| Account equity | Stated | £10,000.00 |
| Maximum risk per trade | 1% of the account | £100.00 |
| Costs and slippage allowance | Stated | £10.00 |
| Available for price movement risk | 100 minus 10 | £90.00 |
| Price risk per share | 50 minus 48 | £2.00 |
| Maximum position size | 90 divided by 2 | 45 |
| Position value | 45 times 50 | £2,250.00 |
| Price move loss at a clean stop | 45 times 2 | £90.00 |
| Total planned loss | 90 plus 10 allowance | £100.00 |
| Gap exit price | Stated | £47.50 |
| Actual price loss per share on the gap | 50.00 minus 47.50 | £2.50 |
| Actual price loss on the gap | 45 times 2.50 | £112.50 |
| Total planned loss | £100.00 | |
Assume a starting account of £10,000, risk per trade of 2% of current equity, and ten consecutive losses, ignoring commissions for simplicity.
The approximate equity path is as follows: start at £10,000, then after the first loss £9,800, after the second £9,604, after the third £9,411.92, after the fourth £9,223.68, after the fifth £9,039.21, after the sixth £8,858.43, after the seventh £8,681.26, after the eighth £8,507.63, after the ninth £8,337.48, and after the tenth £8,170.73.
The drawdown is about 18.3%. What changed is not only the account balance. The same strategy now has less capital to work with, future 2% risk amounts are smaller in cash terms, and a gain of about 22.4% is needed to recover from £8,170.73 back to £10,000.
This is why survival is a first order objective. The account is still alive, but freedom has been reduced. Larger per trade risk would make the same losing streak far more damaging.
| Measure | Basis | Value |
|---|---|---|
| Starting account | Stated | £10,000.00 |
| After first loss | 2% of current equity | £9,800.00 |
| After second loss | Stated | £9,604.00 |
| After third loss | Stated | £9,411.92 |
| After fourth loss | Stated | £9,223.68 |
| After fifth loss | Stated | £9,039.21 |
| After sixth loss | Stated | £8,858.43 |
| After seventh loss | Stated | £8,681.26 |
| After eighth loss | Stated | £8,507.63 |
| After ninth loss | Stated | £8,337.48 |
| After tenth loss | Stated | £8,170.73 |
| After tenth loss | £8,170.73 | |
Checklists
A checklist keeps the process grounded in real exposure rather than hope. It helps ensure that risk has been defined before the trade, monitored during the trade, and reviewed properly afterwards.
Pre trade risk checklist
Open trade and account survival checklist
Glossary
- Account survival
Keeping losses small enough that the account can continue operating through losing periods.
- Correlation
The tendency of positions or assets to move together.
- Drawdown
A fall from account peak to subsequent trough.
- Event risk
Risk from earnings, data releases, policy decisions, geopolitical shocks, or market closures.
- Expected loss
The average loss implied by both probability and loss size.
- Exposure
The amount of market movement the account is subject to through open positions.
- Invalidation point
The price or condition showing the trade idea is no longer valid.
- Leverage
Gaining larger market exposure from a smaller capital base, which magnifies gains and losses.
- Margin
Collateral or deposit required to open and maintain certain leveraged positions; it is not the maximum loss.
- Per trade risk
The planned loss on one position if the exit rule is hit.
- Position sizing
Choosing size so that planned loss fits the risk budget.
- Portfolio risk
Combined risk across all open positions.
- Risk to ruin
The chance of losses reducing the account to a level where meaningful continuation is no longer possible.
- Slippage
Execution at a worse or different price than expected.
- Stop order
An order that triggers when price reaches a specified level, used to try to limit losses, but not guaranteed in all market conditions.
Verified callouts
Why losses and recovery are asymmetrical
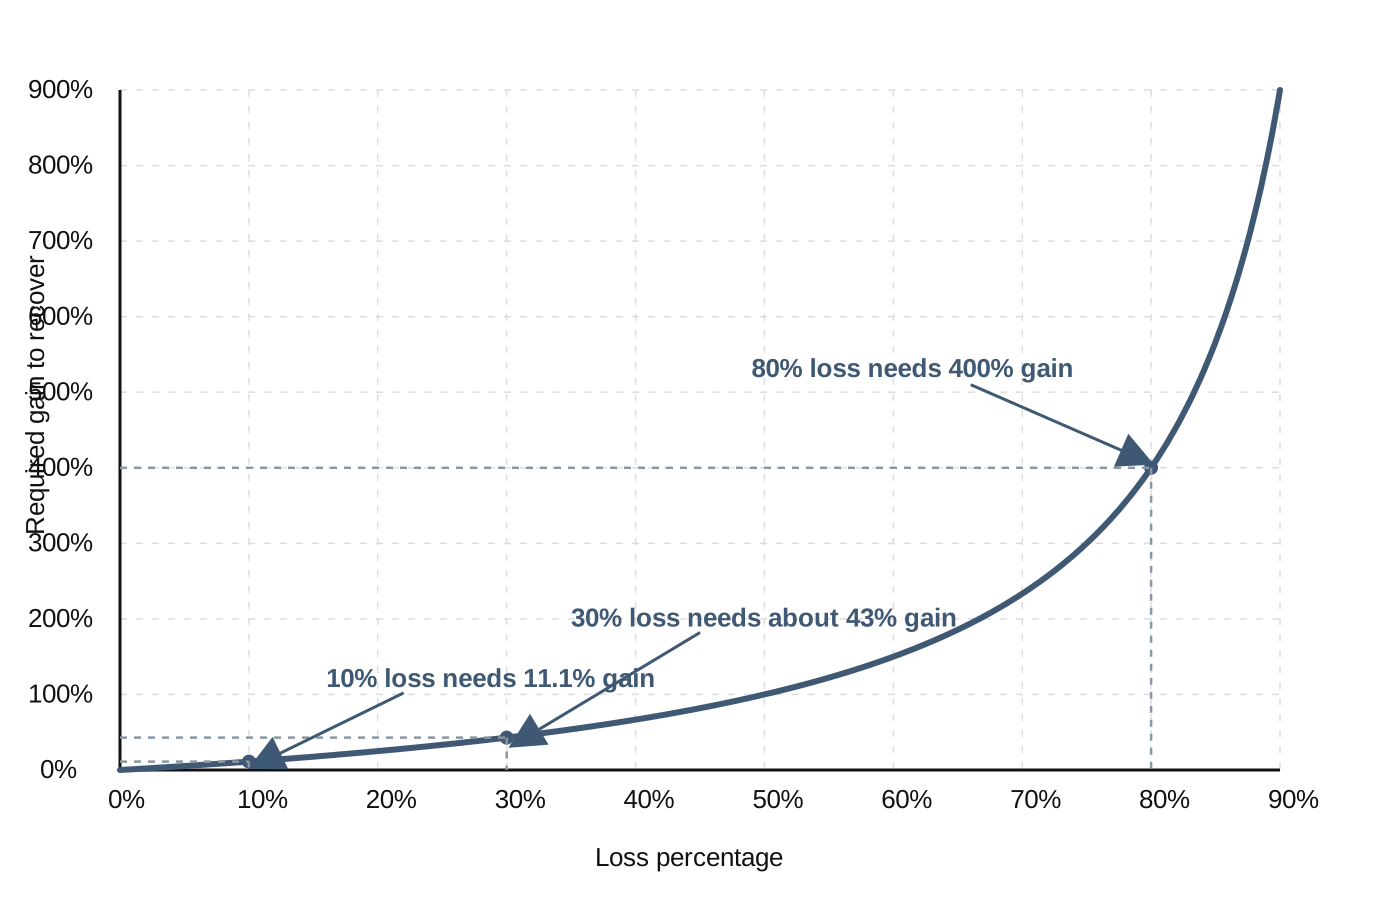
A loss shrinks the capital base, so the percentage gain needed to get back to the starting point is always larger than the percentage loss that caused the damage. For example, a 10% loss needs an 11.1% gain to recover, while a 30% loss needs about 43%. This is arithmetic, not opinion, and it is one reason drawdown control matters so much.
Position size controls loss; it does not predict outcome
Position sizing converts a chosen maximum cash loss into an allowable trade size. It answers how big the trade can be if the trader is wrong rather than how much the trade will make if it is right. Official investor education and exchange materials support this framing by distinguishing exposure, leverage, and margin from certainty about return.
Leverage and correlation can make separate trades behave like one larger risk
Leverage magnifies the account impact of small price moves, and correlated positions can suffer losses together during stress. Official risk materials warn that leverage can accelerate losses, while concentration and correlation can amplify portfolio damage even when individual positions look modest on their own. Clearing risk systems explicitly model volatility, concentration, correlation, and stressed scenarios for this reason.
Internal links
Definitions
- What Is Trading Risk?
- What Is Uncertainty in Markets?
- What Is Expected Loss?
- What Is Drawdown?
- What Is Risk to Ruin?
- What Is Position Sizing?
- What Is Leverage?
- What Is Margin?
- What Is Correlation Risk?
- What Is Concentration Risk?
- What Is Event Risk?
- What Is Slippage?
- What Is a Stop Order?
- What Is a Guaranteed Stop?
- What Is Portfolio Risk?
- What Is Account Survival?
- What Is Risk-Reward Ratio?
- What Is a Losing Streak?
- What Is Recovery From Drawdown?
Sources
- Risk
- Stop Orders: Factors to Consider During Volatile Markets
- Concentrate on Concentration Risk
- Asset Allocation and Diversification
- Leveraged Investing Strategies: Know the Risks Before Using These Advanced Investment Tools
- Foreign Currency Exchange (Forex) Trading For Individual Investors
- Investor Alert: Binary Options and Fraud
- Margin: Know What’s Needed
- Clearing House Risk Management
- Restricting contract for difference products sold to retail clients
- What is Leverage in Trading?
- Slippage Definition
- Putting A Stop To It