

Day Trading, Swing Trading and Investing Compared
Overview
Day trading, swing trading, and investing all involve buying assets with the expectation that price, income, or both will become more favourable later. The main operational difference is time horizon. Once the holding period changes, almost everything else changes with it, including how often decisions must be made, how much execution quality matters, how exposed the position is to overnight moves, how much diversification is practical, and how much friction comes from fees, spreads, taxes, and mistakes.
For regulatory purposes, FINRA defines day trading as buying and selling, or selling and buying, the same security in a margin account on the same day. Operationally, day trading usually means opening and closing positions within the same trading day and relying on intraday price movement and close monitoring. Swing trading usually means holding for several days to several weeks, aiming to capture more of a move while accepting overnight and weekend exposure. Investing usually means building and holding positions over months, years, or decades, with decisions shaped more by business value, diversification, asset allocation, and long-term goals than by short-term price fluctuation.
A useful starting point for beginners is this: the same market view can produce very different results depending on turnover. If three people all think an asset is likely to rise, the one trading in and out frequently will usually face more spread cost, more opportunities for slippage, more tax complexity from short-term transactions, and more chances to make execution errors than the one acting less often. Even where headline commissions are zero, FINRA notes that transaction costs, spreads, and other fees still exist.
This comparison treats day trading, swing trading, and investing as workflows rather than identities. The aim is to show how each style commonly works in practice, how the decision cycle changes with time horizon, and which trade-offs matter most for beginners.
Key definitions
Step by step walkthrough
The process begins with idea generation. A day trader looks for a same-day opportunity, often linked to intraday volatility, volume, or a scheduled event such as earnings or economic data. Because the holding period is short, the thesis is usually about price movement over minutes or hours, not long-term business value.
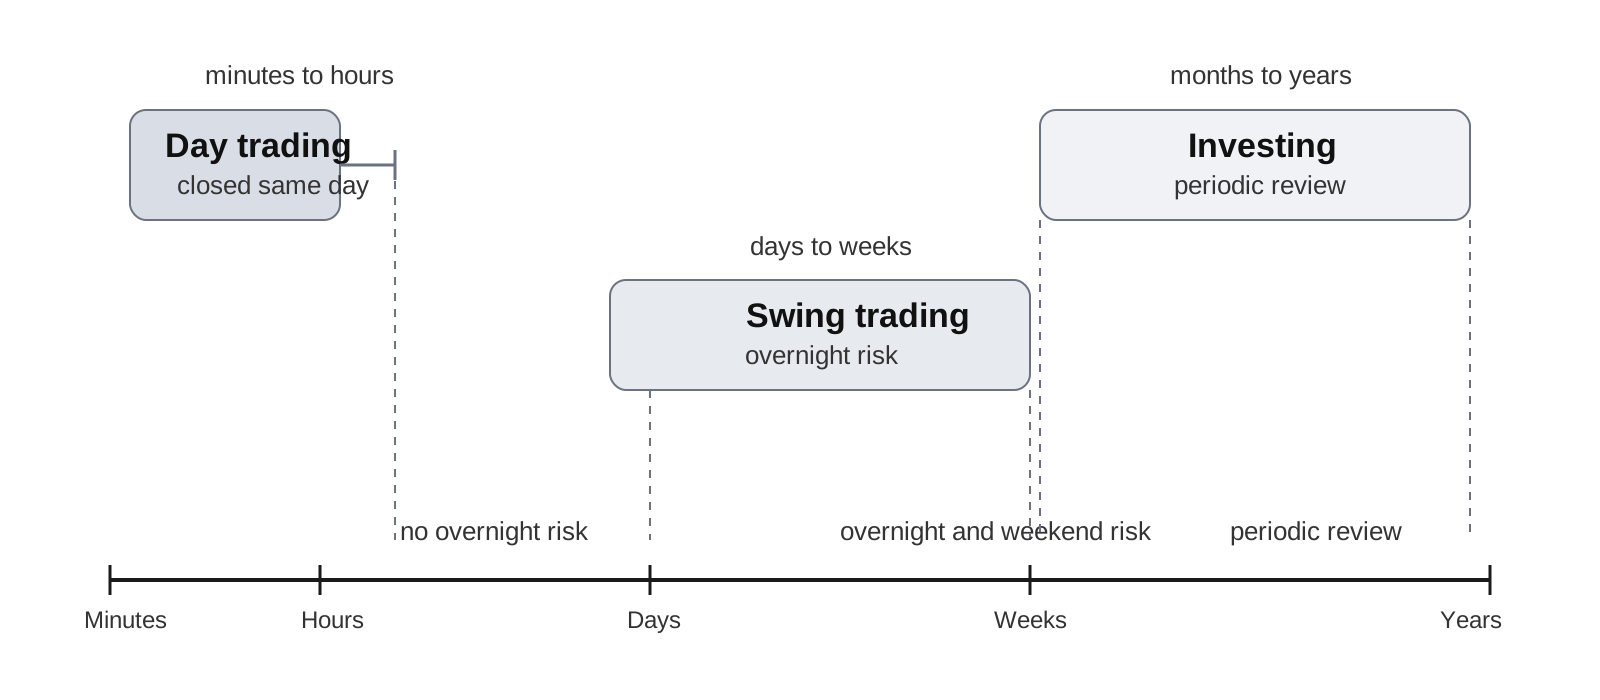
Before entering, the trader plans entry price, maximum loss, target or exit logic, order type, and position size. Execution method matters immediately. Market orders execute at the best available current price, while limit orders specify price limits, so spreads and execution quality can materially affect the result.
Once the position is open, it is monitored closely during market hours. Because the expected move is often small, small costs matter a great deal. The trader then manages the position by watching price action, liquidity, and whether the trade behaves as expected. Stop orders may be used, but because they become market orders when triggered, they can execute at significantly different prices in fast markets.
The position is closed before the session ends to avoid overnight risk. That removes overnight exposure, but it also means the style depends heavily on intraday timing and execution. After the trade, review is essential. The trader records entry, exit, size, rationale, and execution quality because frequent decisions create many opportunities for repeated mistakes.
The comparison loop
The clearest way to compare these styles is to follow the same loop each time: time horizon, research cadence, cost and execution friction, risk handling, and sustainability. Looking at them in that order helps explain why similar market opinions can lead to very different practical outcomes.
Worked examples
The examples below are simplified on purpose. They are designed to show how the same broad market move can have a different meaning once time horizon and turnover change.
Assume an asset starts at 100p and rises to 108p. One position is 100 shares. Ignore dividends. Assume a 2p spread at each trade and no separate commission for simplicity, while remembering that trading costs can still exist even where headline commissions are zero.
In a day trade view, the trader buys in the morning near the ask at 101p and sells later the same day near the bid at 107p. The gross move captured is 6p, so the profit before other costs is 100 multiplied by 6p, which is £6. The market moved 8p overall, but the trader did not capture the full move because the spread was paid on both entry and exit. If slippage occurred, the result could be smaller.
In a swing trade view, the trader buys on day 1 at 101p, holds for five trading days, and sells at 107p. The profit before other costs is again £6. The arithmetic looks similar, but the path is different because the swing trader accepted overnight exposure for several sessions instead of requiring the move to happen within one day.
In an investment view, the investor buys at 101p and holds for 12 months or longer. The position eventually reaches 107p, but the investor may not sell simply because that level was reached. The decision is tied to portfolio allocation or the long-term thesis rather than the fact that an 8p move happened. The same market move is therefore a complete trade for the day trader, one multi-day setup for the swing trader, and possibly just one small step in a much longer holding period for the investor.
| Measure | Basis | Value |
|---|---|---|
| Start price | Asset opens at | 100p |
| End price | Asset rises to | 108p |
| Market move | 108 minus 100 | 8p |
| Day trade entry | Buys near the ask | 101p |
| Day trade exit | Sells near the bid | 107p |
| Day trade captured move | 107 minus 101 | 6p |
| Spread per round trip | Paid on entry and exit | 2p |
| Day trade gross profit | 100 shares times 6p | £6.00 |
| Day trade captured move | 6p | |
Assume 100 shares, an 8p difference in mid-price between entry and exit, spread cost of 2p per share for each completed round trip, and extra fees and slippage combined of 0.5p per share per round trip. Assume the day trader completes 10 round trips in a period, the swing trader completes 2, and the investor completes 1, while each is trying to express the same broad bullish market view over time.
For the day trader, if the full 8p move is captured on a successful round trip, friction is 2.5p per share, leaving 5.5p per share before tax. Over 10 round trips, friction paid totals 25p per share, or £25 for 100 shares.
For the swing trader, 2 round trips mean total friction of 5p per share, or £5 for 100 shares. For the investor, 1 round trip means total friction of 2.5p per share, or £2.50 for 100 shares.
The numbers are simplified, but the principle is robust. Higher turnover increases cost drag even when the market opinion is basically the same. Repeated short-term sales can also create more short-term taxable events than a long holding period, although exact tax outcomes depend on the account, gain or loss, and individual circumstances.
| Measure | Basis | Value |
|---|---|---|
| Friction per round trip | Spread 2p plus fees and slippage 0.5p | 2.5p |
| Day trader friction paid | 10 round trips | £25.00 |
| Swing trader friction paid | 2 round trips | £5.00 |
| Investor friction paid | 1 round trip | £2.50 |
| Captured move per round trip | 8p minus 2.5p friction | 5.5p |
| Day trader friction paid | £25.00 | |
Checklists
Use these checklists to compare styles in a practical order before choosing an approach.
Trading style comparison checklist
Before choosing a style checklist
Glossary
- Ask
The lowest price currently offered by a seller.
- Bid
The highest price currently offered by a buyer.
- Spread
The difference between the bid and ask. It is a direct trading friction and often a hidden cost of turnover.
- Slippage
The difference between the expected trade price and the actual execution price.
- Market order
An order to buy or sell at the best available current price.
- Limit order
An order to buy at or below a specified price, or sell at or above a specified price.
- Stop order
An order that becomes a market order when a specified stop price is reached. Execution price is not guaranteed.
- Liquidity
How easily an asset can be bought or sold without materially moving its price. Lower liquidity often means wider spreads and higher execution risk.
- Volatility
How much price moves over time. Higher volatility can create opportunity, but also increases uncertainty and execution risk.
- Overnight risk
The risk that news or order imbalance outside regular trading hours causes a gap between one session's close and the next session's open.
- Diversification
Spreading holdings across assets or securities so that one holding has less influence on the whole portfolio.
- Wash sale
A loss sale followed by purchase or repurchase of substantially identical securities within the relevant 30-day window before or after the sale, which can affect tax treatment.
Verified callouts
Why turnover changes cost even when the market view is the same
Trading more often usually means paying the spread more often and facing more chances of slippage, even if the underlying market view has not changed. FINRA also notes that zero-commission trading does not eliminate trading costs, because costs can still appear in other forms.
Overnight risk versus intraday risk
Closing a position before the end of the day removes overnight exposure, but it does not remove intraday execution risk or sudden price moves during the session. Holding across sessions adds the possibility of gaps and lower-liquidity conditions outside regular hours, where spreads and volatility can worsen.
Why frequency and stress are not the same as skill
A style that requires more decisions is not automatically more advanced. It simply creates more moments where execution, discipline, and emotional control matter. Long-term investing still requires time, homework, diversification, and risk management, which are different skills rather than lesser ones.
Internal links
Definitions
- What Is Day Trading?
- What Is Swing Trading?
- What Is Investing?
- Holding Period Explained
- Bid, Ask, and Spread Explained
- Market Orders vs Limit Orders
- Stop Orders and Stop-Limit Orders
- Slippage Explained
- Liquidity Explained
- Volatility Explained
- Overnight Risk Explained
- Position Sizing Basics
- Diversification Explained
- Asset Allocation Explained
- Trading Costs and Hidden Fees
- Short-Term vs Long-Term Capital Gains
- Wash Sale Rules Explained
- Margin Accounts and Pattern Day Trader Rules
- Trade Journal and Review Process
- Overtrading Explained
Sources
- Day Trading
- Day Trading: Your Dollars at Risk
- Investing Basics
- Online Investing
- Asset Allocation and Diversification
- Diversify Your Investments
- Asset Allocation and Diversification
- Fees and Commissions
- Trade Execution:
- Stop, Stop-Limit, and Trailing Stop Orders
- Publication 550, Investment Income and Expenses
- Wash Sales
- After-Hours Stock Quote Data
- Disclosure of Order Execution and Routing Practices