

Reading a Price Chart Without Fooling Yourself
Overview
A price chart is a compact record of what traded, when it traded, and over what price range it traded. In common chart formats, each bar or candlestick shows the open, high, low, and close for a chosen interval. That interval is a user choice, such as one minute, one hour, or one day, and charts can also be trade based rather than time based.
A grounded way to read a chart starts with structure, not prediction. First identify the timeframe. Then ask whether price is mostly advancing, mostly declining, or rotating within a bounded area. Only after that does it make sense to mark support, resistance, and any attempted breakout. This order matters because it pushes observation ahead of interpretation and helps reduce hindsight driven storytelling.
Support and resistance are better treated as zones than as exact prices. They are price areas where buying or selling tends to emerge, and repeated reactions there can show where participants previously changed behaviour. Markets do not usually reverse at precisely the same print every time.
Volume can add context, but only if its source is understood. In futures, volume can mean the number of contracts traded across selected venues on the date. In listed US equities, data can be consolidated across exchanges. On charting platforms, displayed volume may depend on the provider, the venue, the asset class, and the timeframe. Some instruments show trade volume, some tick volume, and some none at all.
The practical goal is modest and useful. Read what the chart is showing now, define what would weaken that reading, and avoid turning patterns into promises. Technical analysis is an approach to examining price, rate of change, volume, and open interest, not a guarantee of forecast accuracy.
Key definitions
A trend is a directional market structure. In plain chart reading, an uptrend is commonly recognised by higher highs and higher lows, while a downtrend is commonly recognised by lower highs and lower lows.
A range is a period of repetitive and limited fluctuation where price rotates between an upper and lower area rather than making sustained directional progress. This aligns with the idea of congestion.
Support is a price area where buying is likely to emerge and slow or stem decline. Resistance is a price area where selling is likely to emerge and dampen continued rise.
A breakout is a move beyond an established support or resistance zone. A false breakout is a breakout attempt that fails to hold beyond the zone and returns to the prior structure.
Step by step walkthrough
The reading loop
A useful reading loop is simple. Start with price and timeframe, classify the market as trending or ranging, mark the key zones, check participation context if volume is available and understood, and then define what would invalidate the current reading.
This loop keeps the focus on what the chart is showing now. It also helps stop a reader from jumping straight to a story about what should happen next.
Worked examples
These examples are not promises about outcomes. They show how a chart can be read step by step, how volume can add context when it is available and understood, and how an interpretation can change when structure fails.
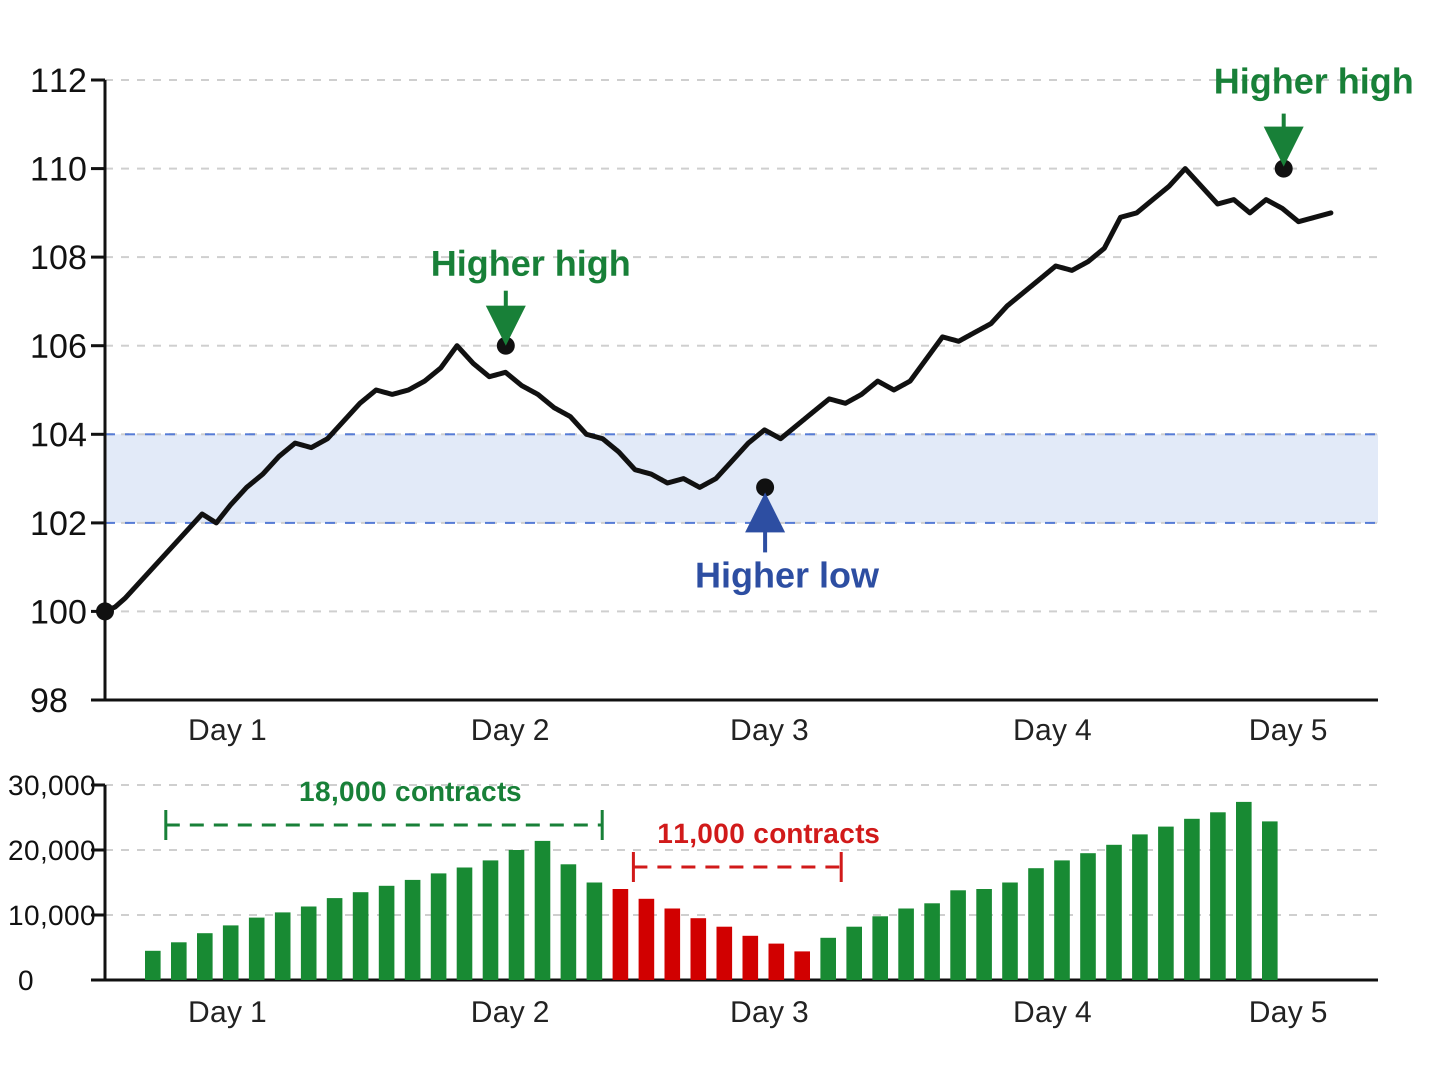
Assume a daily candlestick chart for an instrument that trades with reliable exchange reported volume. Price moves from 100 to 106, then pulls back to 103, then rises to 110.
Reading left to right, price first rallies from 100 to 106. It then pulls back, but the pullback stops at 103, which is above the prior low. Price then pushes to 110.
The sequence has produced a higher high at 106, then a higher low at 103, then another higher high at 110. On this timeframe, that is a straightforward uptrend reading. The 102 to 104 area now deserves attention as support because the pullback found buying there rather than collapsing back to 100.
Suppose the rally from 103 to 110 occurs on 18,000 contracts, while the pullback from 106 to 103 occurred on 11,000 contracts. That does not prove continuation, but it adds context consistent with stronger participation on the advance than on the retracement.
What would change the interpretation is equally important. If price falls back below 103 and cannot recover the zone, the immediate higher low has failed. If price then breaks below 100, the uptrend reading in this example is no longer intact.
| Measure | Basis | Value |
|---|---|---|
| Start price | Stated | 100 |
| First high | Rallies to | 106 |
| Pullback low | Stated | 103 |
| Next high | Rises to | 110 |
| Rally volume | 103 to 110, contracts | 18,000 |
| Pullback volume | 106 to 103, contracts | 11,000 |
| Next high | 110 | |
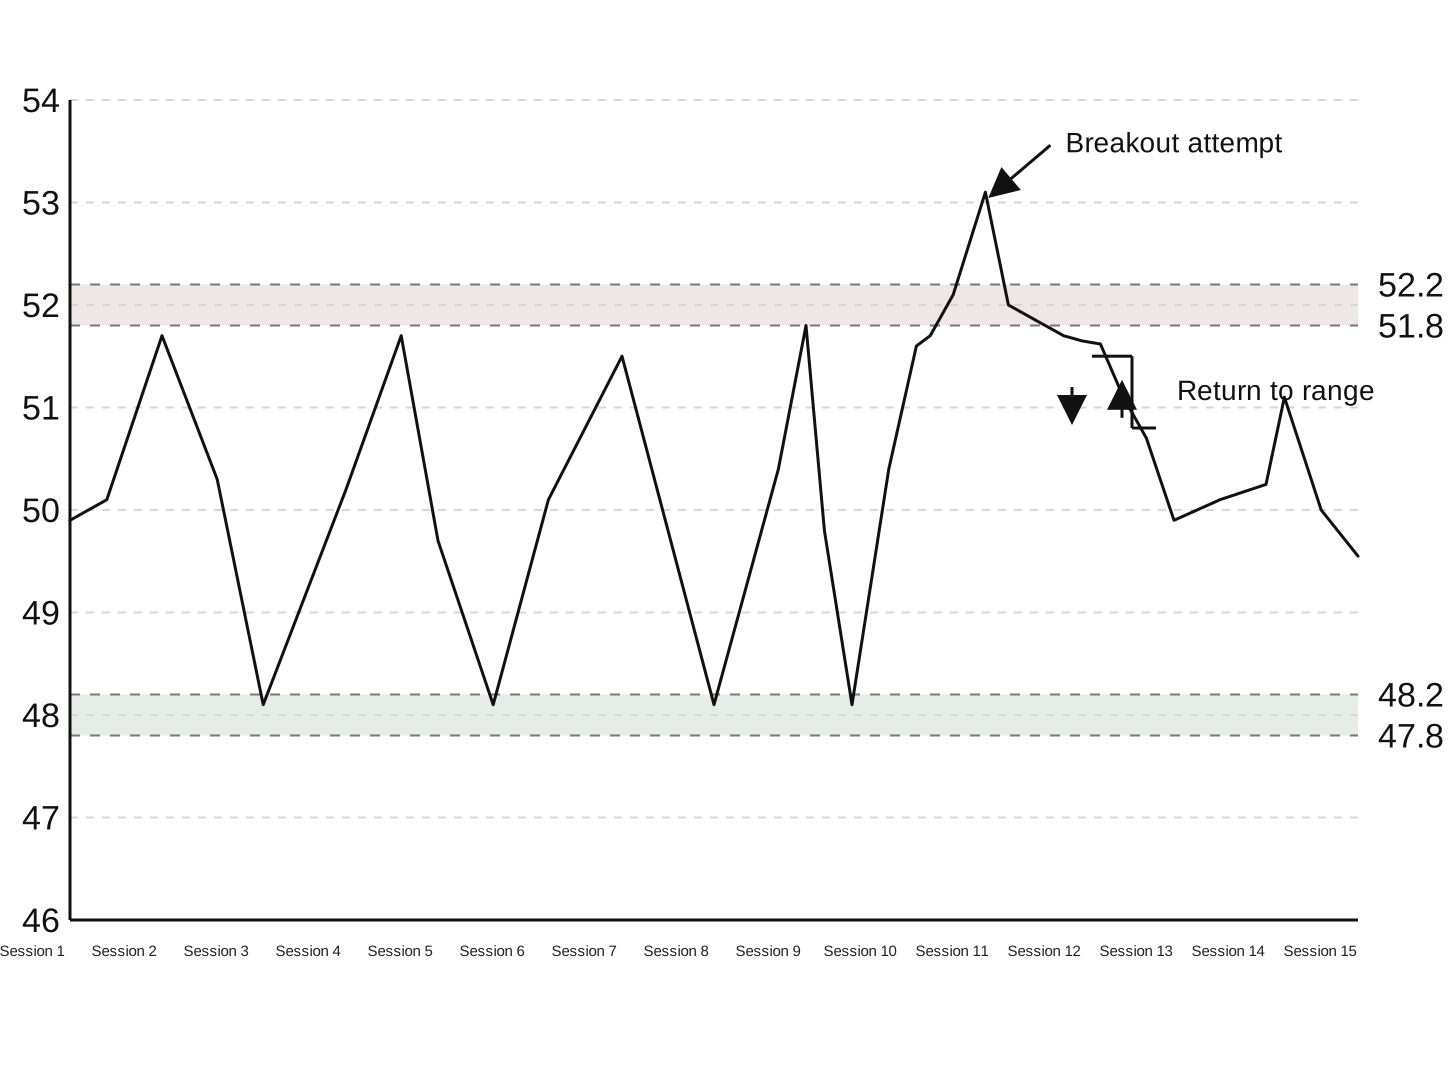
Assume a one hour chart where an instrument oscillates between 48 and 52 for several sessions. Volume is available, but venue specific.
Reading left to right, price reaches 52 three times and turns down each time. It reaches 48 three times and turns up each time. These repeated reactions define a range, with resistance around 51.8 to 52.2 and support around 47.8 to 48.2.
Now suppose price trades up to 52.6 for one bar, then the next two bars fall back to 51.7 and then 50.9. The move above 52 looked like a breakout attempt, but the quick return into the old range weakens the breakout reading and strengthens the false breakout reading.
The important change is not the brief move above 52 by itself. It is the market's failure to hold outside the established zone. If the breakout bar prints moderate volume, but the return into the range also carries strong activity, that does not confirm upside acceptance. It suggests the market did not sustain trading beyond the upper boundary.
What would change the interpretation later is a move above 52 that remains above the former ceiling and starts building higher lows outside the range. That would argue for a genuine change in structure.
| Measure | Basis | Value |
|---|---|---|
| Range low | Turns up from | 48 |
| Range high | Turns down from | 52 |
| Resistance lower bound | Around | 51.8 |
| Resistance upper bound | Around | 52.2 |
| Support lower bound | Around | 47.8 |
| Support upper bound | Around | 48.2 |
| Breakout bar | Trades up to | 52.6 |
| Next bar | Falls back to | 51.7 |
| Following bar | Falls to | 50.9 |
| Breakout bar | 52.6 | |
Checklists
A checklist helps keep chart reading grounded. It slows down the urge to predict and replaces it with a repeatable process for observation, context, and uncertainty.
Pre analysis chart reading checklist
Bias and confirmation checklist
Glossary
- Candlestick
A chart bar with a body and wick showing open, high, low, and close over a chosen interval.
- Bar chart
A chart format that also shows open, high, low, and close for each interval.
- Timeframe
The interval used to create each bar, such as one minute, one day, or one week. Charts may also be trade based rather than time based.
- Trend
A directional market structure, commonly identified by rising swing highs and lows in an uptrend or falling swing highs and lows in a downtrend.
- Range
A period of repetitive, limited fluctuation where price rotates between an upper and lower area.
- Support
A price area where buying is likely to emerge and slow or stem decline.
- Resistance
A price area where selling is likely to emerge and dampen continued rise.
- Breakout
A move beyond an established support or resistance zone.
- False breakout
A breakout attempt that fails to hold beyond the zone and returns to the prior structure.
- Volume
A measure of activity. In CME futures, it is the number of contracts traded. In some platform contexts, the displayed figure may instead be venue specific trade volume, tick volume, or no volume at all depending on the instrument and feed.
Verified callouts
Support and resistance are zones, not precise lines
Support and resistance are best treated as price areas because markets do not usually reverse at exactly the same price every time. Official and industry education describe them as price areas or levels where buying or selling interest tends to appear, and broker guidance explicitly notes that major levels are rarely exact figures.
Volume data can differ by market and venue
Volume is not one universal field across all charts. CME futures volume is defined as contracts traded across CME venues, US equity trade data may be consolidated across multiple exchanges, and chart platforms may show trade volume, tick volume, or no volume depending on the instrument and feed. This means volume should be interpreted in light of the market's data methodology.
Chart patterns describe conditions but do not guarantee outcomes
Technical analysis is an interpretive framework based on price change, rates of change, volume, and related fields, not a guarantee that a named pattern will resolve as expected. Even when official glossaries describe patterns as predictive in theory, that language reflects analytical convention, not certainty, so patterns are safer as descriptions of current conditions and possible scenarios.