

Overview
Many traders first meet the Greeks as formulas. In practice, they are easier to use as exposures. Each Greek tells you how an option price, or an options position, is expected to respond to a small change in one key driver while the others are held constant.
Delta is price exposure to the underlying. Gamma is how quickly that delta changes. Theta is exposure to the passage of time. Vega is exposure to a change in implied volatility. Read together, they give you a compact picture of what your position is leaning on.
This matters because the Greeks are not static labels. They evolve as price moves, time passes and implied volatility shifts. A position that looked balanced on entry can behave very differently a few days later or after a modest move in the underlying.
A useful starting principle is simple: Greeks are sensitivities with units and signs. Before interpreting them, confirm whether your platform shows values per share or per contract, and whether you are looking at a single instrument or a whole position.
Scope and assumptions
This article focuses on four core Greeks: delta, gamma, theta and vega. The aim is practical reading and decision support rather than formula derivation.
All interpretations here are about small changes. Delta measures the option price change for a $1 move in the underlying. Gamma measures the change in delta for a $1 move. Theta measures the change in option price as one day passes. Vega measures the change in option price for a 1 percentage-point change in implied volatility.
Platform display conventions matter. Equity options commonly use a 100-share multiplier, but some products and adjusted contracts differ. Greeks are often shown on a per-share basis, so position exposure needs to be scaled by the contract multiplier and by the number of contracts.
Do not anchor on the last trade when reading an options chain. Last sale can be stale relative to the National Best Bid and Offer. For risk reads and execution judgement, prefer the NBBO or the mid-market and inspect spread width and quoted size.
Keep one distinction in mind throughout: delta is the hedge ratio for small moves and is sometimes used as a rough, model-dependent probability proxy, but it is not literally the risk-neutral probability of finishing in the money.
Main narrative
Start with what each Greek is exposed to
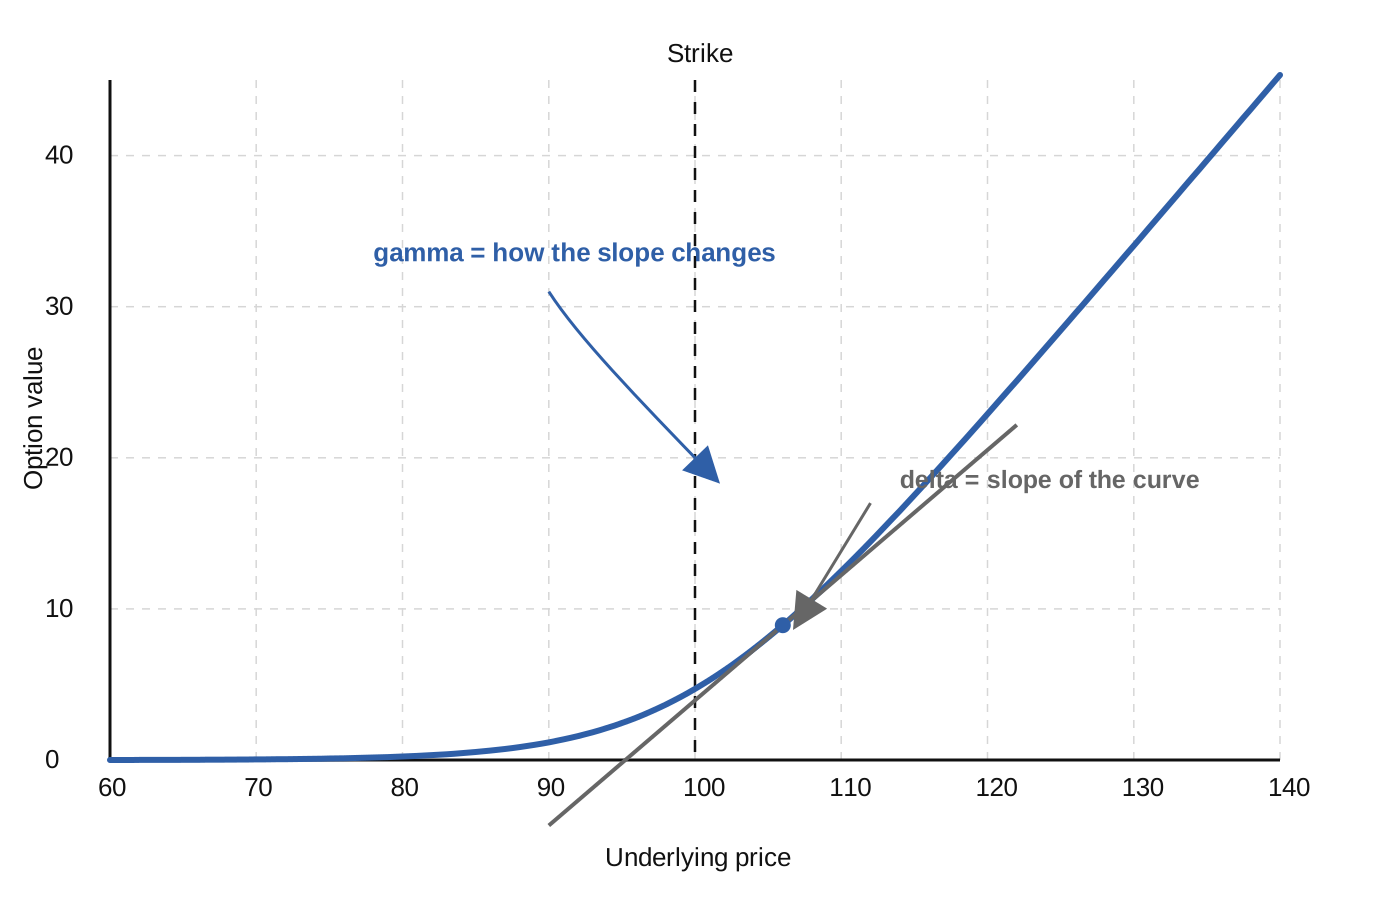
Delta is your directional exposure. It measures the change in option price for a $1 move in the underlying, with other inputs held constant. Calls have positive delta and puts have negative delta. On many platforms this appears per share, so a displayed delta of +0.50 on a standard equity option is roughly +50 deltas per contract once multiplied by the usual 100-share contract size.
Gamma tells you that delta will not stay still. It measures how much delta changes for a $1 move in the underlying. Long options have positive gamma and short options have negative gamma. Gamma is typically highest near the money and rises as expiration approaches, which is why short-dated at-the-money positions can change character quickly after even a modest price move.
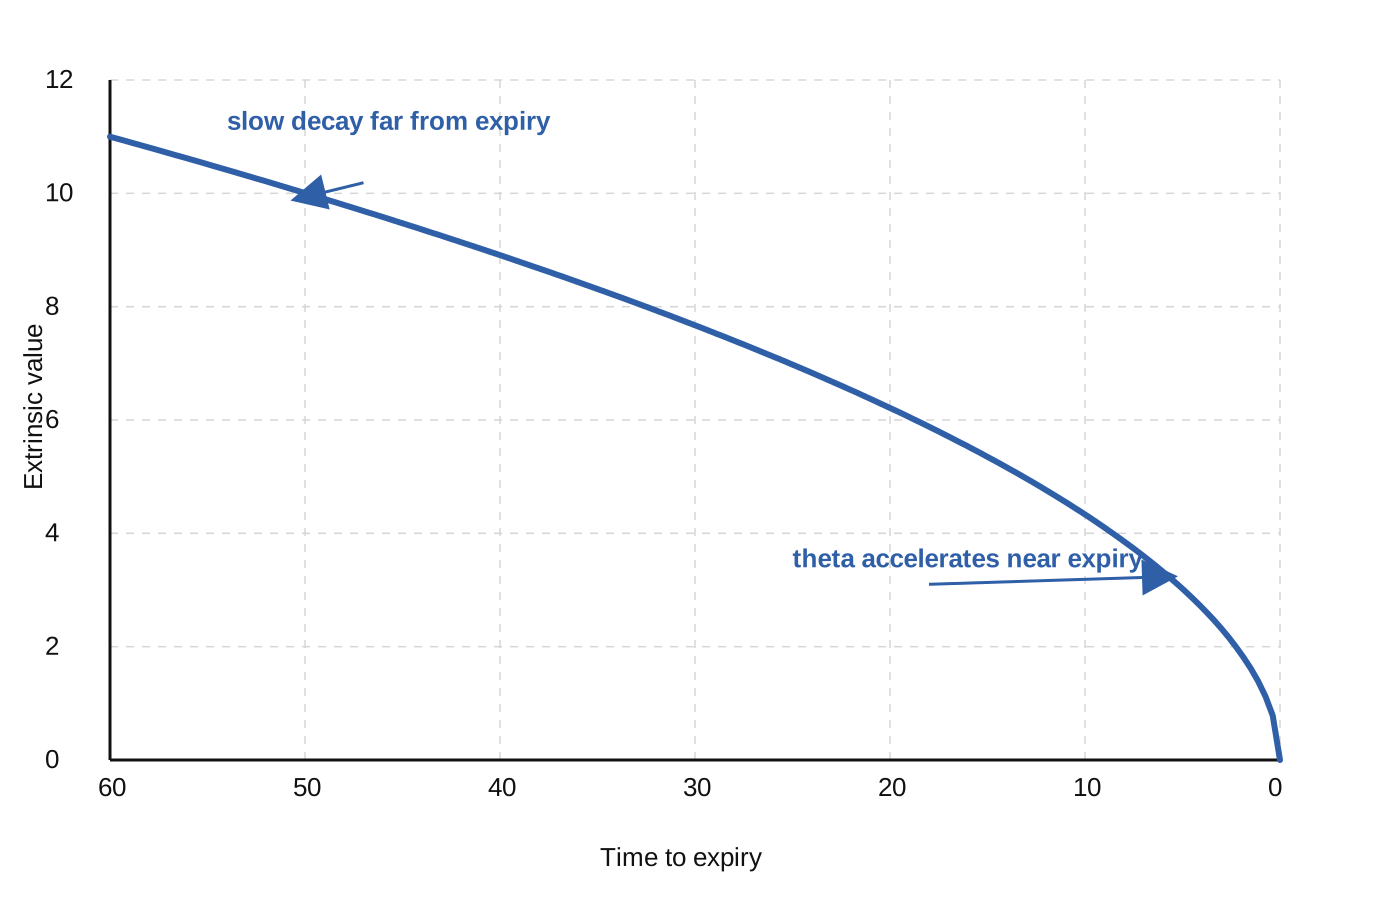
Theta is your time-decay exposure. It measures how much option value changes as one day passes, other inputs held constant. For long options, theta is typically negative. Time decay also is not linear. It tends to accelerate as expiry nears and is relatively small for options that are far in the money or far out of the money.
Vega is your implied volatility exposure. It measures the change in option price for a 1 vol-point move in implied volatility. Vega is usually largest for at-the-money options and larger for longer expirations. That means a position can move materially even when the underlying does not, simply because implied volatility changed.
Then scale the numbers properly
A Greek on the chain is only the starting point. To get the position exposure, multiply the per-share Greek by the contract multiplier and by the number of contracts. If a platform shows vega of 0.04 per share, that is about $4 per standard equity option contract for a 1 vol-point move. Without that scaling step, it is easy to understate the true exposure.
Also check whether the platform is showing instrument Greeks or position Greeks. Many tools offer both. One view tells you the sensitivity of a single leg. The other tells you the exposure after quantity and direction are applied. That distinction matters especially in spreads, where one leg may offset part of another.
Use an exposure loop, not a one-off reading
A practical workflow starts on the chain. Identify the relevant Greeks, but read them alongside the NBBO, spread width and quoted size. If the last trade is stale or the spread is wide, the displayed mark can give a misleading impression of current risk and achievable execution.
Next, aggregate. Convert each leg to position exposure, then sum by underlying and across the wider book if needed. That turns a list of contracts into a usable picture of net directional exposure, convexity, time decay and volatility sensitivity.
Then run simple scenarios. Shift the underlying up or down by a small amount and ask how delta and gamma together change the position. Advance the clock by a day or several days and recheck theta. Move implied volatility by a few points and see how much of the expected change comes from vega rather than price. A calculator or platform risk tool can help you vary price, time and IV together and observe the updated Greeks and theoretical values.
Finally, decide whether anything needs adjusting. If net delta has moved beyond your chosen threshold, you may want to reduce or hedge. If expiry is approaching and the position is near the money, monitor gamma and theta more closely because P and L can become more jumpy. If there is known event risk ahead, recognise that implied volatility can dominate the move, particularly in at-the-money options where vega is often largest.
A simple example makes the idea concrete
Suppose the underlying is $100 and you buy one at-the-money call with 14 days to expiry for $3.00. The chain shows delta +0.50, gamma 0.06, theta -0.08 and vega 0.10 per share. On a standard 100-share contract, that is roughly +50 delta, +6 gamma, -$8 per day of theta and +$10 per vol point.
If the underlying rises by $1 on the same day and implied volatility is unchanged, delta moves from about 0.50 to about 0.56. The option gains roughly $0.50 to $0.60 per share from the delta effect, and your position becomes longer stock-equivalent after the move because positive gamma lifted delta.
If three trading days pass with the price back at $100 and implied volatility unchanged, theta implies about $24 of decay per contract, using the simple starting estimate. As expiry gets closer, gamma and theta both tend to become larger than they were at entry. So even with price unchanged, the risk profile has evolved.
If price is $101 and implied volatility is 2 points higher at that later point, you now have both price exposure and volatility exposure working together. Using the starting figures as a simple guide, the price effect is about $0.56 per share and the volatility effect about $0.20 per share, for a combined change of about $0.76 per share before second-order effects.
The same reading applies to spreads
Now take a short put spread: sell one 95 put and buy one 90 put with 21 days to expiry for a net credit of $1.00. Using the illustrative net Greeks from the research, the spread begins with roughly delta -0.15, gamma -0.02, theta +0.03 and vega -0.05 per share. In plain English, it is short downside, short gamma, long theta and short volatility.
If the underlying stays at $100 but implied volatility rises by 5 points, the spread value rises against you by about $0.25 per share, or about $25 per contract, from vega alone. No price move is needed. That is exactly why Greeks are more useful as exposures than as formulas. They help explain why a position can lose money for reasons that are not obvious if you only watch the stock price.
If later the underlying dips toward $96 with only a few days left, delta becomes more negative and gamma more negative near the short strike. Mark-to-market swings increase as expiration nears because short-dated near-the-money options carry more gamma and more theta. In that environment, many traders would at least reassess size, hedge needs or whether to roll to reduce gamma exposure.
Keep the definitions clean
Two points are worth preserving because they are often blurred. First, delta is an exposure to small price changes, not a literal probability. Second, Greeks are local measures. They describe sensitivity around the current state. As price, time and volatility move, the Greeks themselves change. That is why scenario checks and repeated monitoring are part of sound options practice, not an optional extra.
Displayed Greeks may be per share rather than per contract. Failing to scale by the contract multiplier and number of contracts can understate exposure.
Platforms may show instrument Greeks or position Greeks. Confusing the two can lead to incorrect aggregation and poor adjustment decisions.
Last trade can be stale relative to the NBBO. In illiquid contracts, anchoring on last sale rather than current bid and ask can misread both risk and execution quality.
Delta is a small-move hedge ratio and only a rough, model-dependent proxy for probability. Treating it as a literal probability is a category error.
Near expiry, at-the-money options can carry high gamma and fast theta. Short-dated positions can therefore become more sensitive and produce sharper P and L swings.
Implied volatility changes can dominate price behaviour, especially in at-the-money options and around known events. A position can move materially even if the underlying barely moves.
Adjusted or atypical contract multipliers can appear after corporate actions or in special products. Standard assumptions do not always apply.
Verified callouts
Delta is an exposure to small price changes, not a probability
Delta measures the small-move sensitivity of an option to its underlying and acts as a hedge ratio. Traders may use it as a rough probability proxy, but it is not literally the risk-neutral probability of finishing in the money.
Vega is per 1 vol point and is usually largest near the money
Vega measures the change in option price for a 1 percentage-point change in implied volatility. For a given expiration, it is typically largest for at-the-money options, and longer expirations generally carry larger vega.
Gamma shows how quickly delta changes and tends to grow into expiry
Gamma measures the rate of change of delta for a $1 move in the underlying. It is typically highest near the money and increases as expiration approaches, which is why short-dated at-the-money options can become very sensitive to price moves.
Update log
- Cboe Equity Options Specifications
- OIC Volatility and the Greeks
- Cboe European-Style Option Implied Volatility Calculation Methodology
- OIC Gamma Overview
- OIC Theta Overview
- CME Group Options Vega – The Greeks
- Interactive Brokers TWS Notes on Instrument and Position Greeks
- OIC Understanding the Bid and Ask Prices for Options
- OIC Volatility Skew and Options: An Overview
- Cboe Options Calculator
- Cboe Options Institute Glossary
- SEC Filing on Adjusted Contracts and Non-Standard Deliverables